
Your nephew built your website. He says it loads fast. He checked it on his new phone, on the office Wi-Fi, sitting down.
Your customers check it on a three-year-old phone, in a dark crawlspace, with one bar of signal and a flashlight in their teeth. Those are two very different websites.
Google has a free tool that tests your site the way a customer sees it. It is called PageSpeed Insights. Here is how to use it, and how to read it without a computer science degree.
Short answer
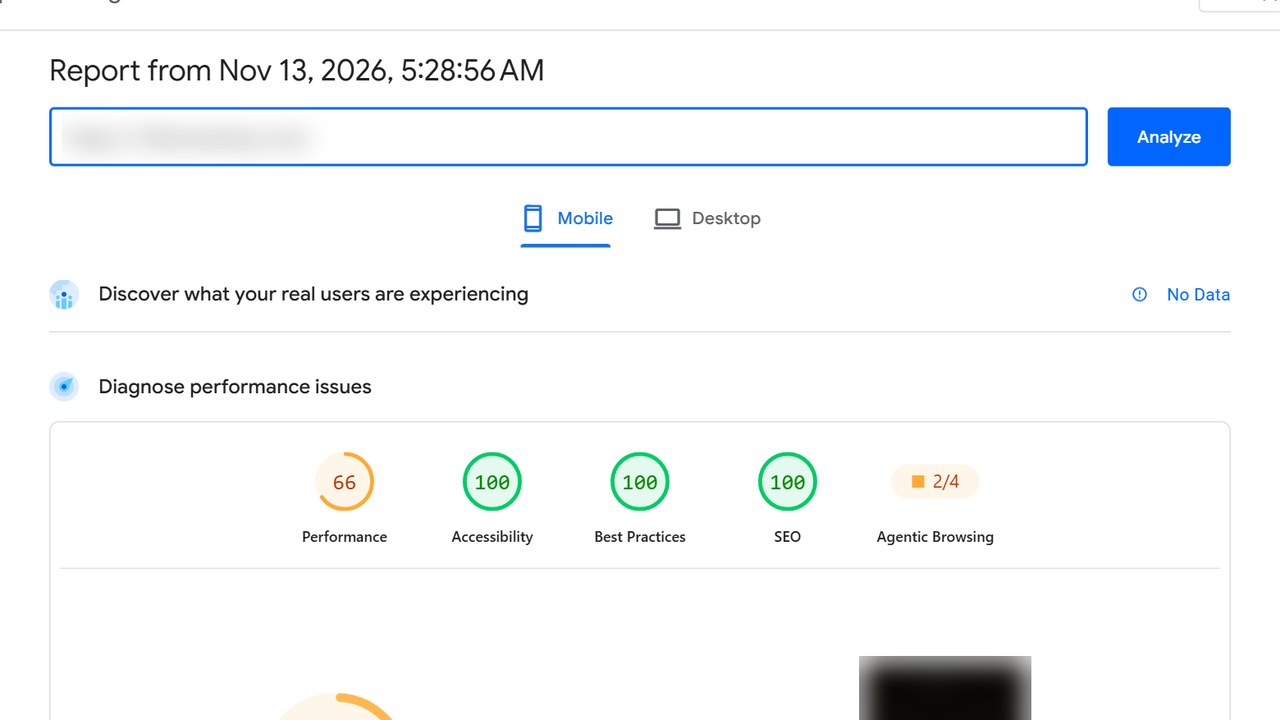
Go to pagespeed.web.dev, paste your homepage address, press Analyze and stay on the Mobile tab. The top section, “Discover what your real users are experiencing,” shows real Chrome visitors over the last 28 days; the bottom section, “Diagnose performance issues,” is a one-off lab test that shows what to fix. Many small business sites get no real-user data because they don’t have enough Chrome visitors. That is normal, not a penalty: use the lab test and aim for the main content within 2.5 seconds.
Step by step: run the test
Step 1: Open PageSpeed Insights
Go to pagespeed.web.dev on a computer. It works on a phone too, but the report is easier to read on a bigger screen. It is free and you don’t need to sign in.
Step 2: Paste the page you want to test
Start with your homepage. Then test the page that brings in the most calls, often your main service page, like “Water heater repair.” Each page gets its own result.
Step 3: Press Analyze and wait
Press the blue Analyze button. The test loads your page from Google’s side and usually finishes in under a minute.
Step 4: Stay on the Mobile tab
The report has two tabs at the top: Mobile and Desktop. Make sure Mobile is selected. Your customers are mostly on phones, and the mobile test is the tougher one.
Step 5: Read the two halves separately
The report has two sections that look alike but measure different things. Mixing them up is the most common mistake people make with this tool.
The top half: real customers (field data)
The first section is called “Discover what your real users are experiencing.” Google calls this field data. It comes from the Chrome User Experience Report, a record of how real Chrome users experienced your page over the previous 28 days.
Here is what to look at:
- “This URL” and “Origin.” “This URL” is the exact page you tested. “Origin” is your whole website added together.
- “Core Web Vitals Assessment: Passed” or “Failed.” This is the headline. It tells you whether your real visitors got a good experience by Google’s standard.
- The three numbers under it: Largest Contentful Paint (LCP), Interaction to Next Paint (INP) and Cumulative Layout Shift (CLS). Good is 2.5 seconds or less, 200 milliseconds or less, and 0.1 or less.
We explain what those three numbers mean, in plain words, in what is page speed, and how slow is too slow.
One detail most guides skip: not every visitor is counted. Google’s CrUX documentation says only Chrome users who have usage reporting and history sync turned on are included, on desktop or Android. Chrome on an iPhone doesn’t count, and neither does Safari. So if most of your customers use iPhones, this section sees only part of them.
The bottom half: the lab test
The second section is called “Diagnose performance issues.” This is a test Google runs right now, once, with a tool called Lighthouse. When we ran it in November 2026, the report said it used an emulated Moto G Power phone with “Slow 4G throttling.” In plain words: a mid-range phone on a so-so connection.
At the top you get a Performance score from 0 to 100. Google’s guide says 90 or above is good, 50 to 89 needs improvement, and below 50 is poor.
That score is built from five measurements. Google’s Lighthouse documentation gives the weights:
- Total Blocking Time: 30% (how long the phone is too busy running code to respond)
- Largest Contentful Paint: 25%
- Cumulative Layout Shift: 25%
- First Contentful Paint: 10% (when anything at all appears)
- Speed Index: 10% (how quickly the screen fills in)
Why your score changes every time you test
Run the test twice and you may get 62, then 71. That is normal. Google’s Lighthouse documentation says most of the swing isn’t Lighthouse itself, but changing conditions, such as ads that change, internet routing, and the device running the test.
So don’t celebrate or panic over one run. Run it three times and go by the middle score. And trust the real-user section over the lab score whenever you have it.
“No data”: what it means for a small business site
For many local trade websites, the top half shows no real-user numbers at all. Owners often think something is broken, or that Google is ignoring them. Neither is true.
Google’s CrUX documentation says a page must be public and “sufficiently popular” to get field data, meaning it needs a minimum number of visitors. Google doesn’t publish that number. PageSpeed Insights’ own guide says that when a page doesn’t have enough data, it falls back to your whole site (the Origin). If the whole site doesn’t have enough either, it can’t show any real-user data.
Remember, only some Chrome users are counted in the first place. So for a small local site, an empty top section is nothing unusual.
What to do about it:
- Use the lab test as your guide. Watch the LCP number. Under 2.5 seconds is the target.
- Test before and after every change, like a new photo, a new plugin or a new chat widget. Three runs each.
- Test the pages that matter, not just the homepage. If you have city pages, test one of those too (and make sure they are real pages, not copy-paste city pages Google treats as spam).
What to fix first
Below the score, the lab test lists things it found, with headings like “LCP breakdown” and suggested savings. The list can look scary. Don’t try to fix all of it.
Look for these first, because on trade websites they are the usual culprits:
- Anything about images: too big, wrong format, or loaded late. Usually the big photo at the top of your homepage.
- Anything about third-party code: chat widgets, review badges, tracking tools, pop-ups.
- Server response time: if your server is slow to answer, that points at hosting.
If the list doesn’t make sense to you, that is fine. It wasn’t written for you. Our free audit runs this same mobile test on your homepage and turns the results into plain words.
And remember that a fast page still has to do its job once it loads. Check that it shows what a contractor website needs on the first screen: a call button, your service and city, and a reason to trust you.
Do this this week
- Test your homepage on pagespeed.web.dev, Mobile tab, three times. Write down the middle score and the LCP.
- Test your main service page the same way.
- Check the top section. Passed, failed, or no data? Write it down.
- Find the first item about images in the lab results and send a screenshot to whoever runs your site.
- Test again after any change to the site, so you know if it helped.
Common questions
Is PageSpeed Insights really free?
Yes. It is Google’s own tool at pagespeed.web.dev. You don’t need an account, and you can test any public page, including your competitors’.
Should I look at mobile or desktop?
Mobile first. It is closer to how customers find you. The desktop test assumes a computer on a wired connection, so its scores usually look better. Nice to see, but it is not where most of your calls come from.
Why does my score change every time I test?
Google’s Lighthouse documentation says scores move with things like internet routing, changing ads and the device running the test. Run it three times and use the middle result.
Why does PageSpeed Insights say there’s no data for my site?
Your page doesn’t have enough visits from the Chrome users Google counts. It is common for small business sites and is not a penalty. The lab test below still works.
What score should I aim for?
Google calls 90 and above good. More important is the main content (LCP) showing up within 2.5 seconds on the mobile test. A plumber with a 75 and a clear call button beats one with a 98 and nothing to tap.
Where to start
Run the test on your homepage right now, while this is open. Two minutes. Then you know where you stand.
If you want someone to read the results with you, ask for our free audit. We test your site on a phone and show you, with screenshots, what to fix first.
Sources
- Google, PageSpeed Insights, report screens seen 12 November 2026. pagespeed.web.dev
- Google, PageSpeed Insights documentation, “About PageSpeed Insights,” read 12 November 2026. developers.google.com/speed/docs/insights/v5/about
- Chrome for Developers, “CrUX methodology,” read 12 November 2026. developer.chrome.com/docs/crux/methodology
- Chrome for Developers, “Lighthouse performance scoring,” read 12 November 2026. developer.chrome.com/docs/lighthouse/performance/performance-scoring
- web.dev (Google), “Web Vitals,” last updated 31 October 2024. web.dev/articles/vitals